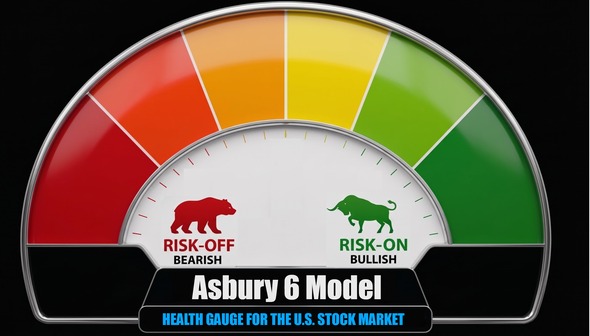

RISK-OFF (BEARISH)
2 of 6 Positive Metrics
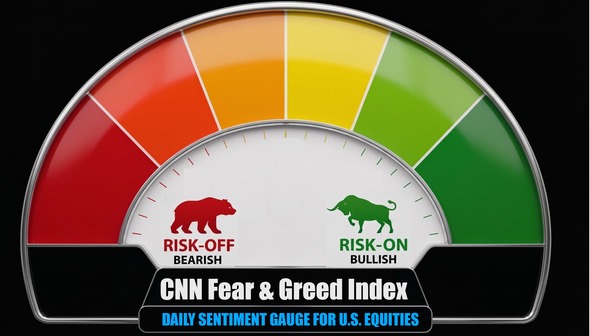
Fear: 26.2
CNN Fear & Greed Sentiment (0 to 100)
This week's model allocation
-
Equal-weighted top-3 sectors by composite multi-horizon rank. Rebalanced weekly. For research illustration only.
Top 3 Weekly SEAF Total Return-
S&P 500 Total Return-
Top 3 Weekly SEAF CAGR-
Top 3 Weekly SEAF Max Drawdown-
Sector Rankings (Multi-Horizon)
Favored 3-15 Neutral 16-24 Avoid 25-33
| # | Sector | Composite | Class | Trading (wk) | Tactical (mo) | Strategic (qtr) | Wkly Flow |
|---|
Per-Sector Proxy Series, Last 12 Months
Trading (wk) Tactical (mo) Strategic (qtr)
Hypothetical Backtest, Top 3 Weekly SEAF Model vs S&P 500 (since Jan 2021)
Top 3 Weekly SEAF Model S&P 500 (SPY)
This is an independent research illustration. It currently uses a Chaikin Money-Flow style price/volume proxy because clean historical daily ETF creation/redemption (true asset-flow) data is not freely available. Results are hypothetical, do not include transaction costs, and are not a reproduction of any proprietary commercial model. Past performance does not guarantee future results.